×
模态框(Modal)标题
在这里添加一些文本
Close
Close
Submit
Cancel
Confirm
×
模态框(Modal)标题
×
Chinese
|
English
Toggle navigation
JPRMG
Home
About Journal
Editorial Board
Journal Online
Current Issue
Online First
Archive
Most Read
Most Download
Most Cited
E-mail Alert
Instruction
Guidelines for submissions
Open access
Publication Ethics
Contact Us
中文
Figure/Table detail
The Resonant Noise Reduction Method of Muzzle Shock Wave Based on NOA-VMD
YANG Haoyue, MENG Xiangrui, JU Mingchi, WANG Yingzhi
JPRMG
, 2024, 44(
4
): 9-17. DOI:
10.15892/j.cnki.djzdxb.2024.04.002
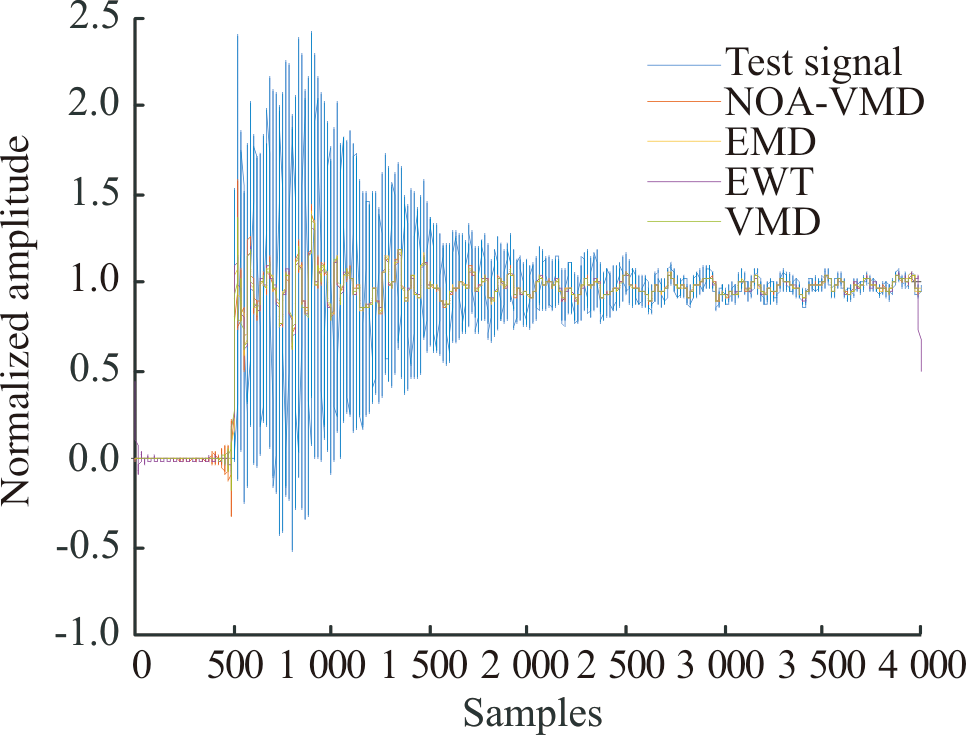
Fig.10
Time domain of the noise reduction algorithms
Other figure/table from this article
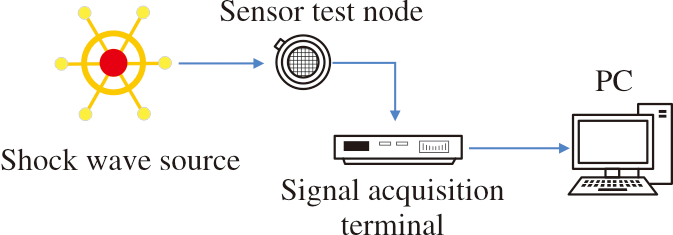
Fig.1
Schematic diagram of shock wave test device distribution
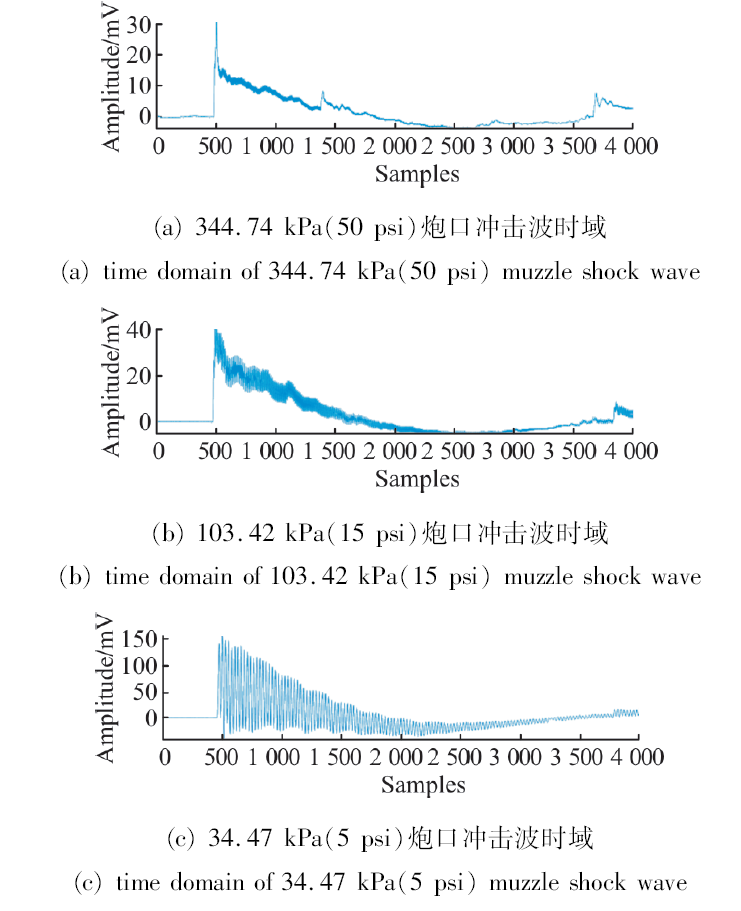
Fig.2
Time domain diagram of muzzle shock wave
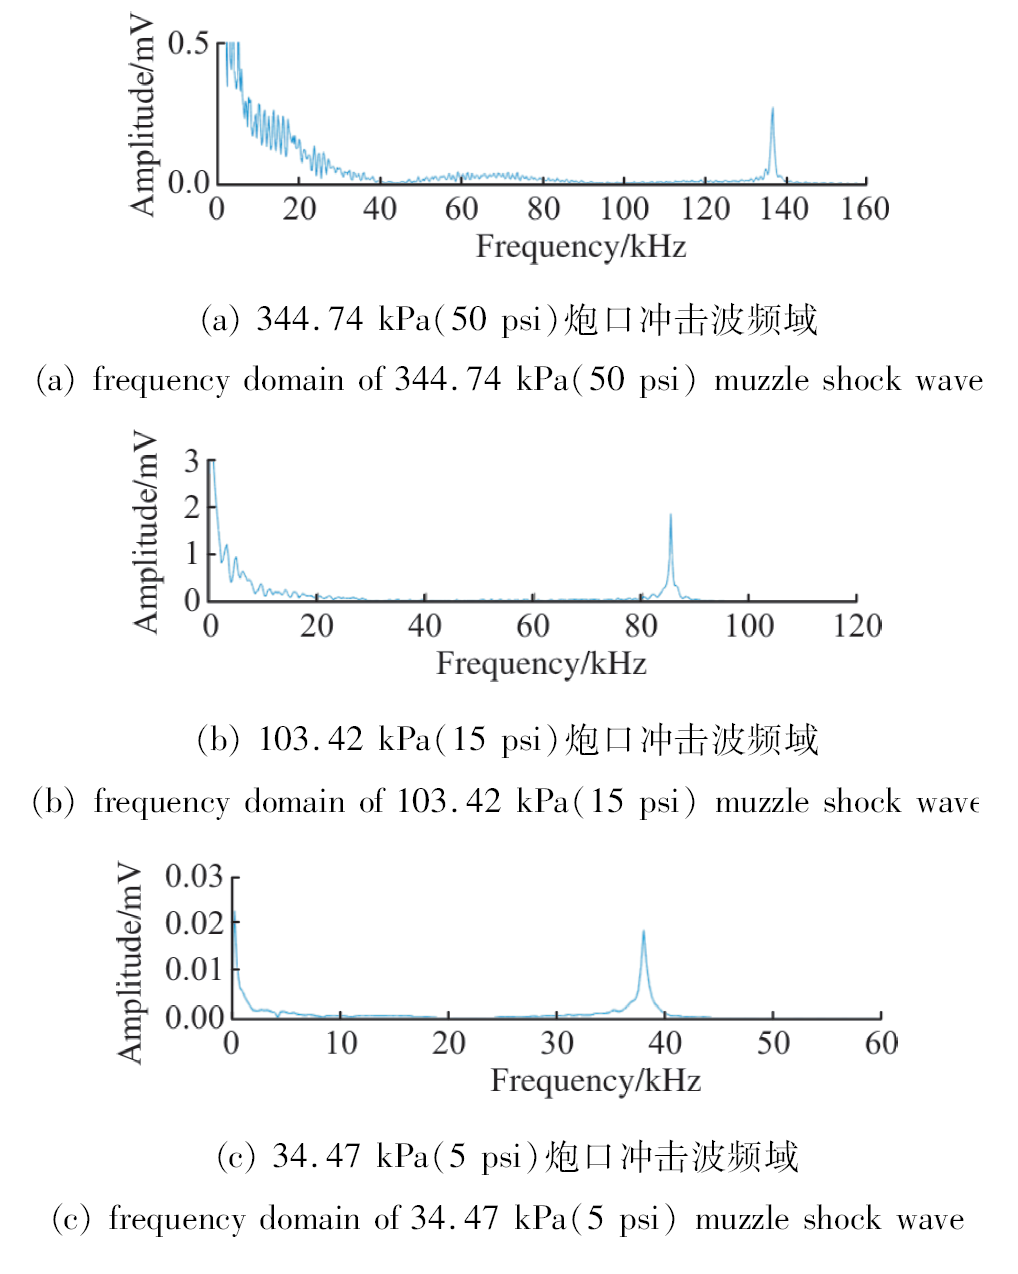
Fig.3
Frequency domain diagram of muzzle shock wave
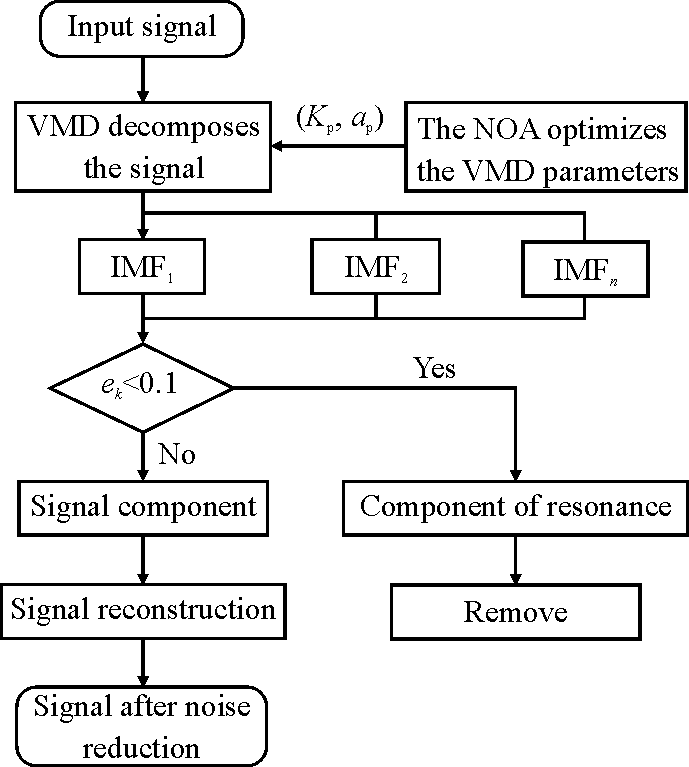
Fig.4
Flow chart of signal resonant noise reduction
Table 1
Table of NOA parameters
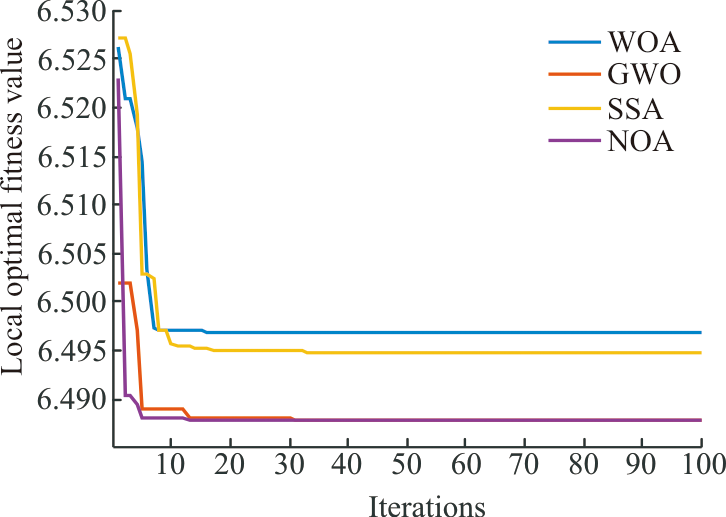
Fig.5
Comparison of fitness function curve results
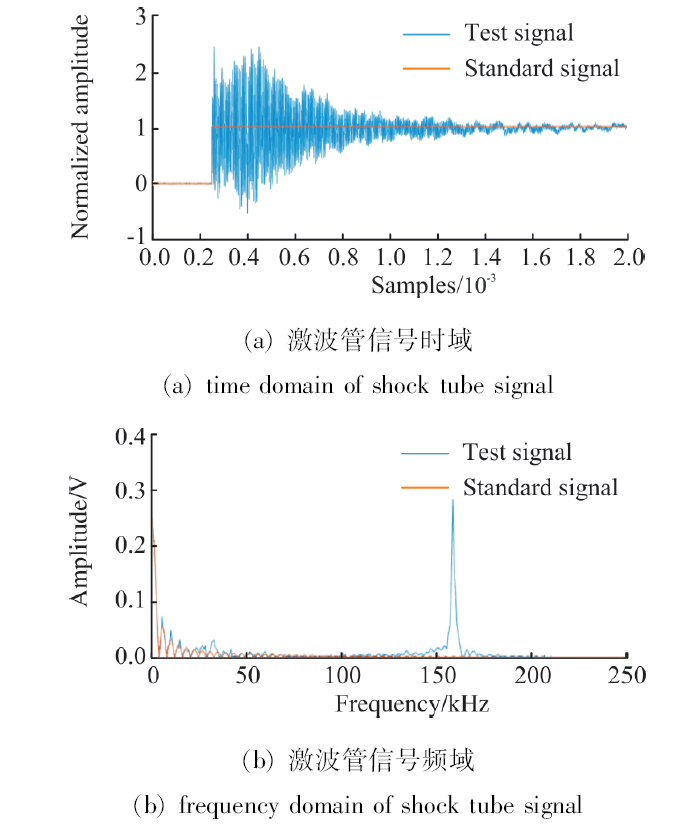
Fig.6
Time and frequency domain diagram of shock tube signal
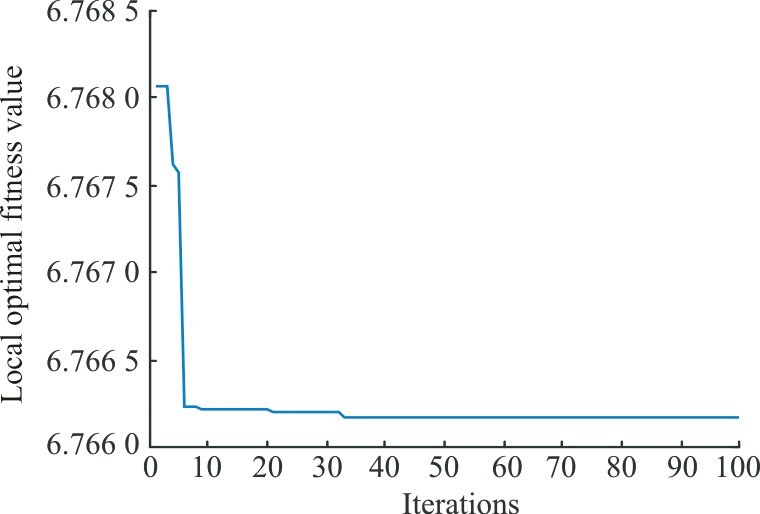
Fig.7
Curve of fitness function of shock tube test signal
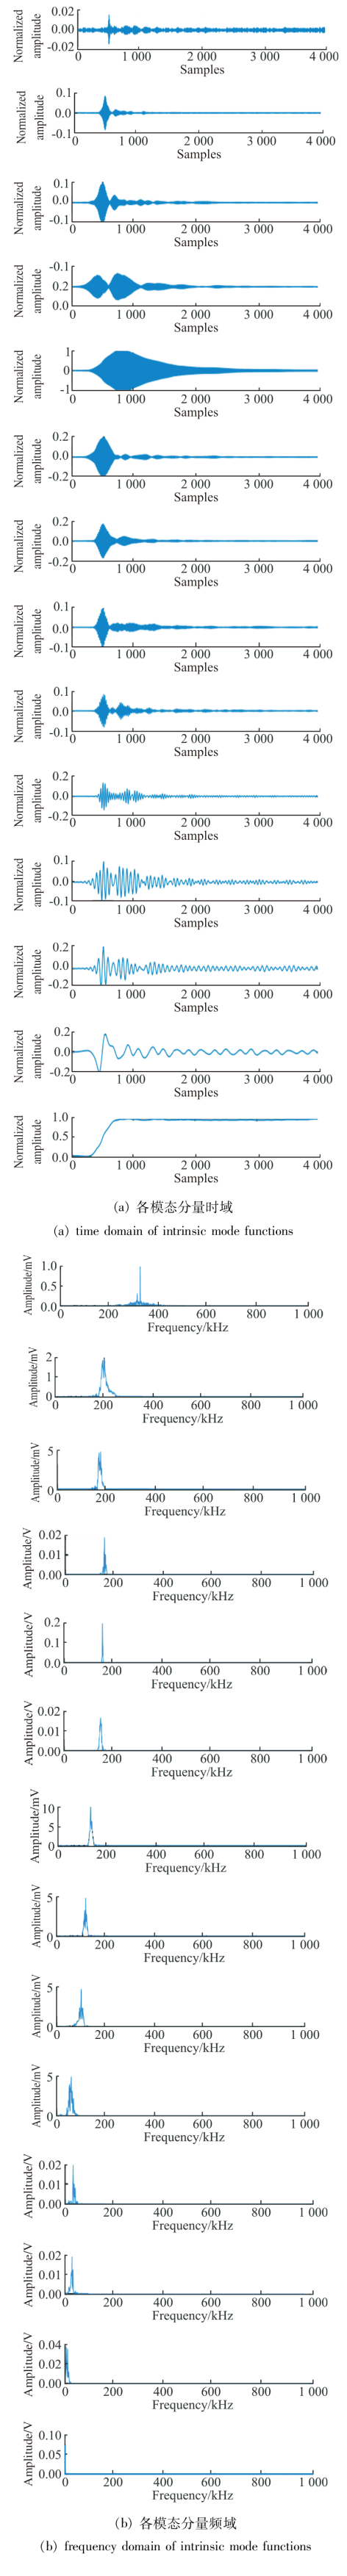
Fig.8
Intrinsic mode functions diagram of shock tube test signal
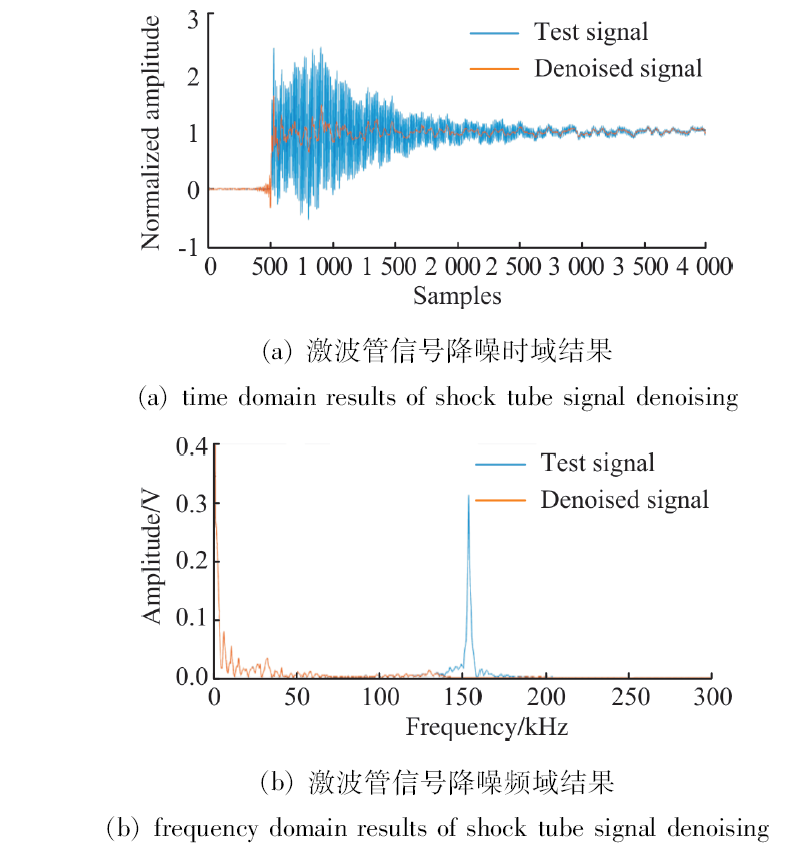
Fig.9
Result of noise reduction of shock tube signal
Table 2
Statistical table of shock tube test signal and noise reduction signal parameters
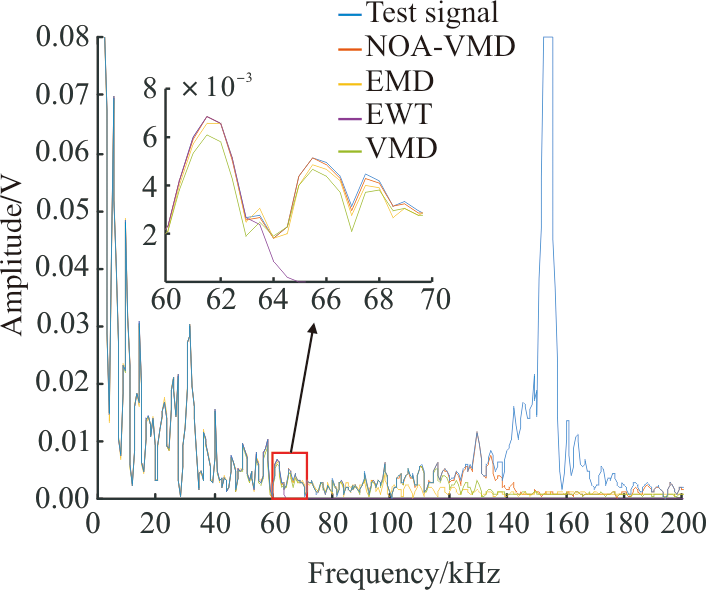
Fig.11
Frequency domain of the noise reduction algorithms
Fig.12
Time domain comparison of shock wave
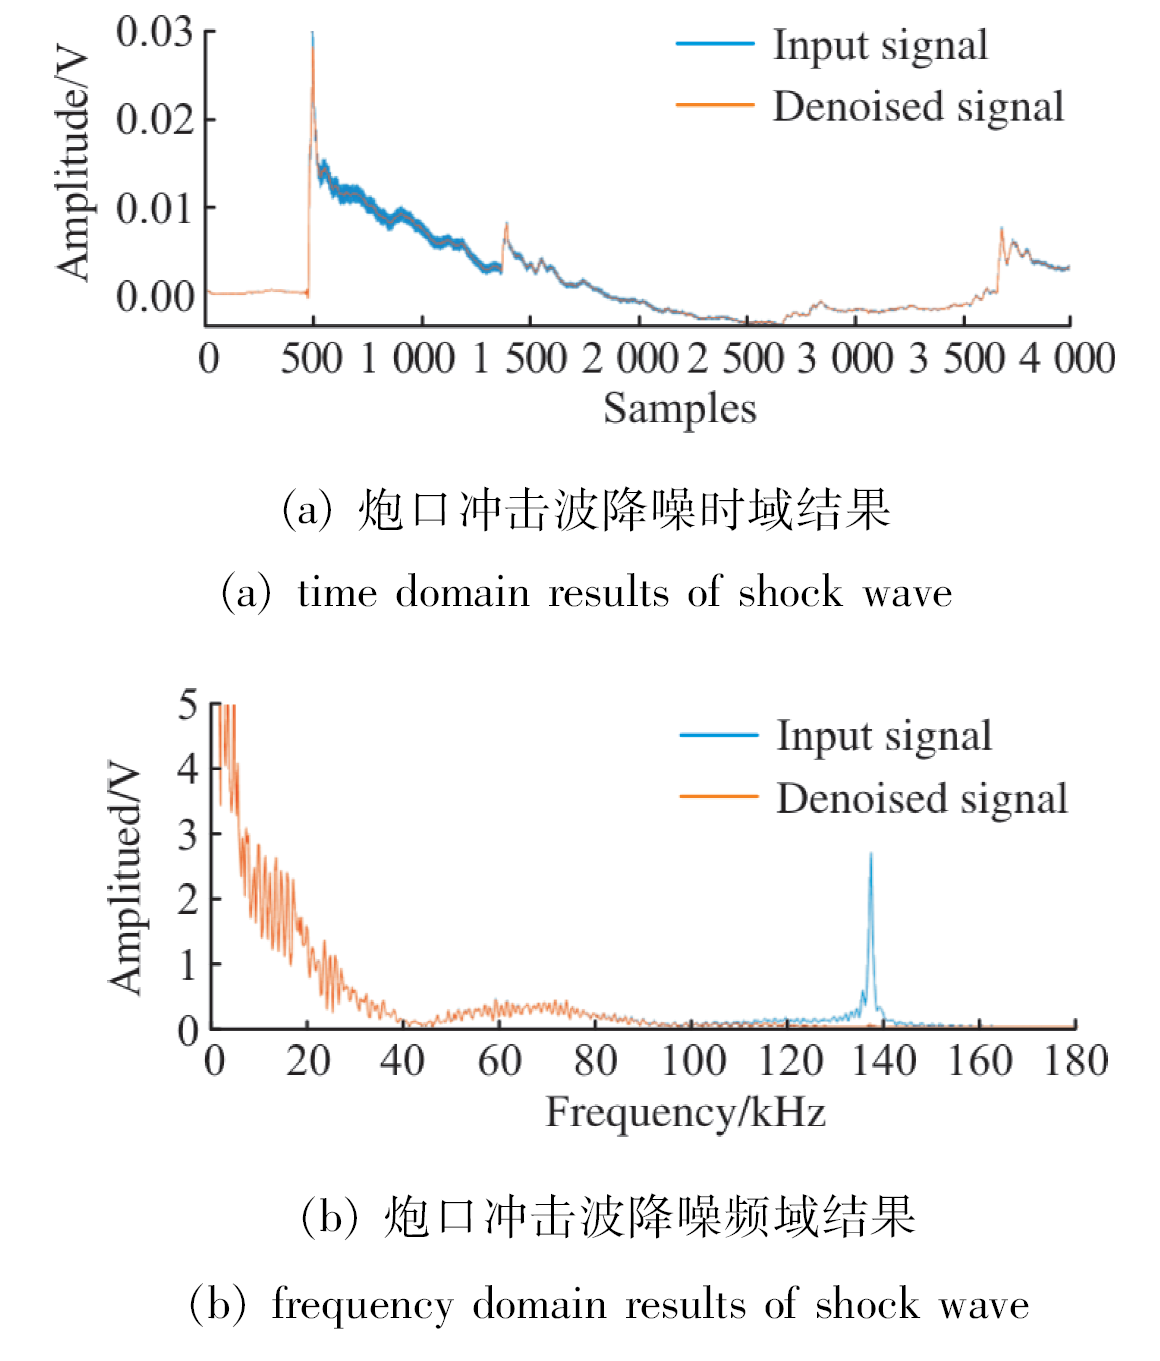
Fig.13
Result of shock wave denoising
Fig.14
Result of shock wave denoising
Table 3
Statistical table of muzzle shock wave parameter characteristics before and after noise reduction